bob_bosewell/iStock via Getty Images
Written by Nick Ackerman, co-produced by Stanford Chemist.
The last time we touched on Cohen & Steers Total Return Realty Fund (NYSE:RFI), we also took a look at Cohen & Steers Quality Income Realty Fund (RQI). These funds are quite similar in terms of their approach in terms of investing in mostly equity real estate investment trust (“REIT”) securities but also include a sleeve of preferred and fixed-income instruments. In fact, for RFI and RQI, the funds mirror each other exactly currently, with 81% listed as invested in common stock and 19% in preferred and fixed-income.
The major difference between the two is that RQI also incorporates leverage into its strategy while RFI remains non-leveraged. Since that previous update in May 2023, RFI slightly outperformed RQI on a total share price basis. However, this was reversed on a total NAV return basis. This indicates that while RQI’s portfolio performed better – it wasn’t actually reflected in the market price.
Ycharts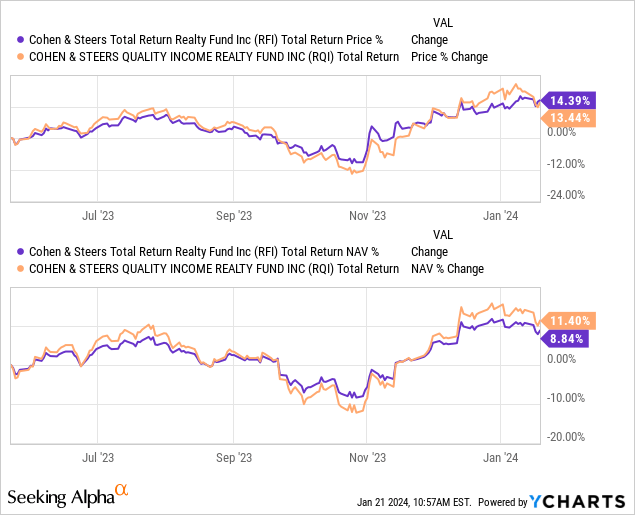
This is where discounts/premiums can play a role in changing the outcome of the results. For both of these funds, we saw the actual market prices outperform their underlying portfolios. More specifically, RFI’s premium would have expanded while RQI’s discount narrowed but not as significantly.
I’d still lean toward looking at RQI as the more attractive play today, but RFI is still fairly attractive for those investors who want to avoid adding any leverage at all.
RFI Basics
1-Year Z-score: 0.62 Premium: 2.66% Distribution Yield: 8.02% Expense Ratio: 0.96% Leverage: N/A Managed Assets: $317.32 million Structure: Perpetual
RFI’s investment objective is “to achieve a high total return.” They’ll attempt to achieve this “through investment in real estate securities. Real estate securities include common stocks, preferred stocks and other equity securities of any market capitalization issued by real estate companies, including real estate investment ruts (REITs) and similar REIT-like entities.”
With no leverage in terms of borrowings, that’s one less moving part we have to worry about for this fund. That keeps the fund’s total expense ratio lower, but funds that do employ borrowings are ideally earning those costs back through better performance. That’s not always the case, but that’s the idea.
Performance – Fairly Attractive At Fair Value
RFI continues to trade at a slight premium today, but the current valuation is around the usual premium level that the fund tends to trade at. At least over the last 3 and 5-year periods.
Over the longer-term decade history, the fund can be seen as trading at a fairly deep discount prior to around 2018. During 2018, the fund flirted with a premium, and while it was fairly short-lived – presumably influenced by the Q4 2018 broader market correction – it didn’t take long for that premium to return once again. Now, it has mostly stayed at a premium that’s been pretty sticky for five years or so.
Ycharts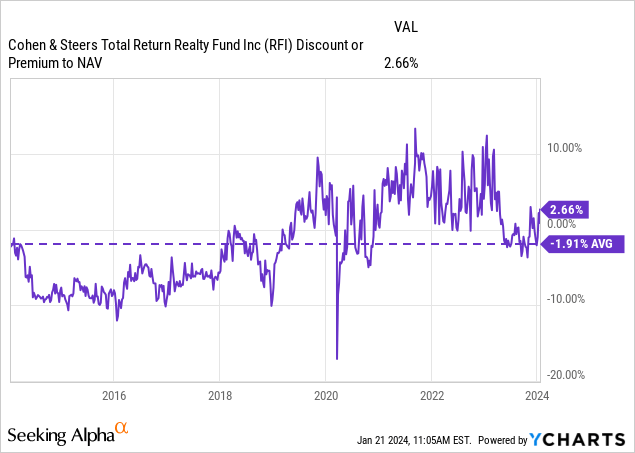
That said, a fairly valued CEF can still be attractive, given the current economic conditions one might anticipate. I’m personally expecting REITs to be a better place to put capital to work going forward. The main catalyst for lifting REITs higher would be the expected rate cuts. We don’t know exactly when or how aggressive cuts will be, but we are looking at the Fed projecting 3 cuts this year with more in 2025.
That could return more investor interest back to the REIT space in a search for income. We already saw a swift rebound in the space when risk-free Treasury Rates started to fall. Similarly, preferreds can also get a lift as their yields would also start to become more attractive.
Lower rates from the Fed would also mean that REIT’s own leverage costs that they utilize would also ease off, providing some potentially better growth going forward. This is something to consider when you invest in a leveraged fund such as RQI. If there is a recovery, it is likely that RQI could continue to outperform, but that does mean taking on higher risks and potentially greater volatility.
RFI historically has delivered rather attractive total returns on an annualized basis. They’ve beaten both their Blended and Linked Indexes on a total NAV return basis or acme close on a 3, 5, 10 and since inception period. The inception of the fund was going back toward the end of 1993 – so we are looking at a fund with quite the track record.
This data is as of December 31, 2023, meaning we are looking essentially at 2023’s performance when looking at a YTD and 1-year period.
RFI Annualized Performance (Cohen & Steers)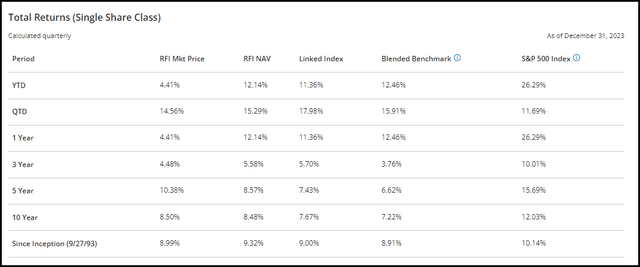
Where we see a big underperformance in 2023 was on a market price basis, and that’s because RFI’s share price came in at a hotter premium of around 6% to start off the year. At one point during the year, it spiked to double-digits, but that was a fairly short period of time.
RFI Vs. RQI Performance
For curiosity’s sake, here is a look at RQI’s annualized performance as well. Besides the inception period due to RQI coming to the market much later in 2002, RQI’s leverage has resulted in positive results through this period.
RQI Annualized Performance (Cohen & Steers)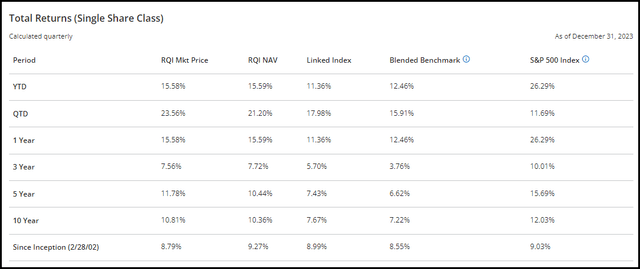
However, this was after a meaningful recovery for the sector, and if we go back to Covid, we can see that RQI did underperform. The below measures the period from February 19, 2020, to March 23, 2020.
Ycharts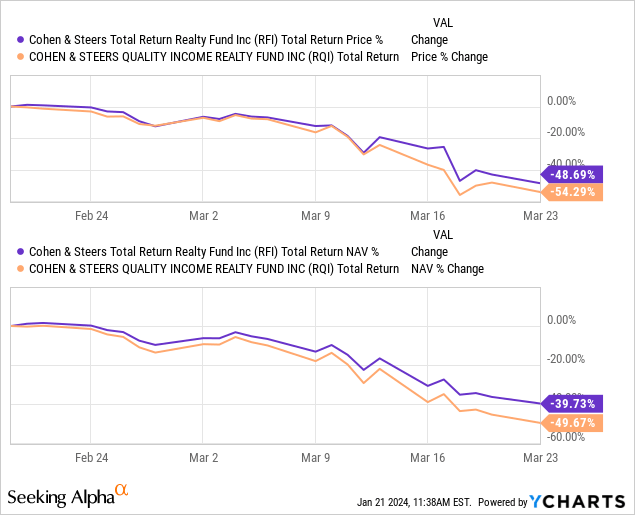
Personally, I was buying during the Covid crash, so the deeper losses here were welcomed to buy even cheaper. Clearly, I’m an aggressive investor. In this scenario, I was lucky enough that it worked out as the recovery from the Covid low worked out.
Ycharts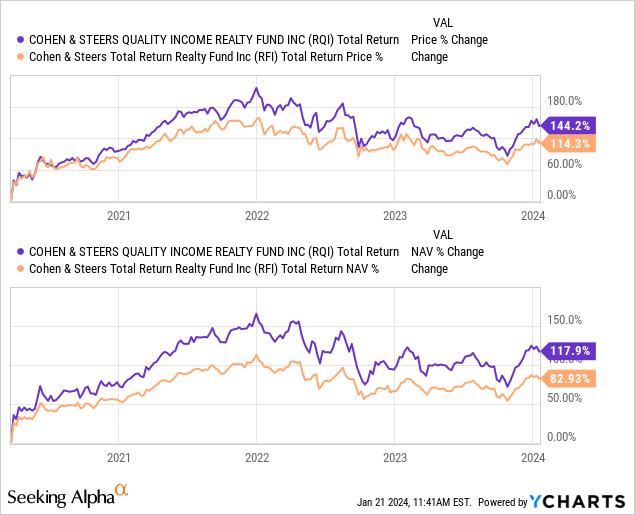
Distribution – Steady Monthly Distribution
RFI has been paying a fairly steady monthly distribution for a number of years now. It also launched with a monthly distribution – but similar to its sister funds – they cut the distribution during the Global Financial Crisis. When doing that cut, they went to a quarterly distribution for a period of time until switching back to a monthly schedule, where the same payout of $0.08 is today.
RFI Distribution History (CEFConnect)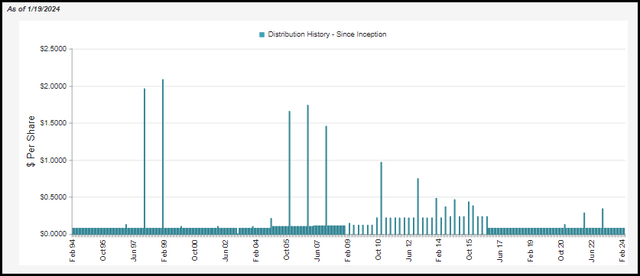
The fund’s current distribution rate comes to 8.02%. Due to that bit of premium pricing, the NAV rate comes in a touch higher at 8.23%
The fund, similar to its sister funds, will require capital gains to cover their payout. This isn’t anything too unique in the CEF space, specifically funds like RFI, which are primarily equity-focused funds.
In their last semi-annual report, we can see that net investment income coverage came in at around 34.6%. NII was on the rise relative to last year, too, which is a positive sign. To help contribute to the fund’s capital gains potential, the fund also writes options contracts and participates in forward foreign currency exchange contracts and foreign currency transactions. As of the latest report, these transactions did not have a meaningful positive or negative impact on the fund.
RFI Semi-Annual Report (Cohen & Steers)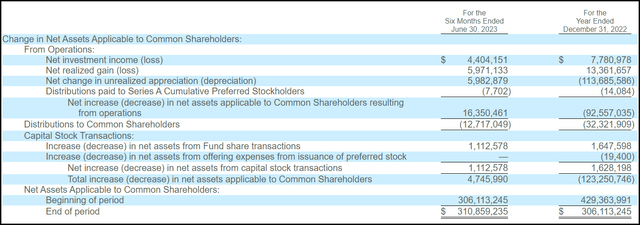
On a per-share basis, NII for 2022 was $0.30, and for the six-month period, we saw $0.17 – or an annualized figure of $0.34. The per-share figure can be a better indicator in this case because of RFI’s premium. Due to the premium, the fund can issue shares through an at-the-market offering or through their DRIP. Due to having more capital to invest, NII would naturally rise, but the per-share figure still reinforces that it was a positive for the fund.
We don’t have the 2023 figures just yet, but looking back at the tax classifications of the distribution from 2022, we can see how the distribution was broken up.
RFI Distribution Classification (Cohen & Steers)
Primarily, it was a significant portion of capital gains, but non-qualified income contributed to a meaningful portion as well. That puts it in a situation where an argument could be made for a tax-sheltered account or a taxable account.
RFI’s Portfolio
The turnover for the fund was fairly low at just 9% based on the last six-month report. That put it on pace to be less active than in 2022, when we saw a turnover of 28%. That itself was a slowing pace of changes compared to 2021’s 38% and 2020’s relatively active year of 53%.
With that being said, we’ve seen some fairly small portfolio gyrations in terms of sector weighting. The latest breakdown below is as of the last factsheet for the period ended December 31, 2023.
RFI Sector Allocation (Cohen & Steers)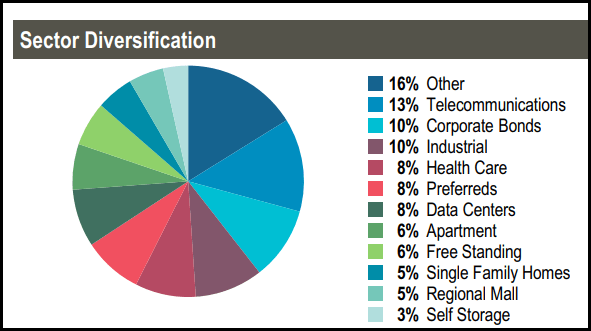
When compared to our prior update, the “other” category has grown here to become the largest. This was previously at a 10% allocation, which then pushed down the industrial sector weighting to 10% now from the top sector weighting of 12% previously. That wasn’t a substantial change in itself and is something that could simply happen from values moving around.
This was a particularly volatile period as it was looking at the data as of the end of March 2023. That means we saw the banking crisis, the October lows and the rapid November/December recovery in this period. For such a strong year for the broader market, that was primarily driven by the Magnificent 7. REITs ended up doing okay, but it was a much more volatile year for the space as interest rates ended up having a more meaningful impact on the space.
In total, the fund listed 163 total holdings. However, similar to RQI, this fund holds a heavy concentration within the top ten – with the top five even comprising a rather material allocation on its own thanks to the fund’s largest holding, American Tower Corp. (AMT). This is a weighty 10.2% weight for the fund, which was lifted from the prior 5.7% breakdown it was previously.
RFI Top Ten Holdings (Cohen & Steers)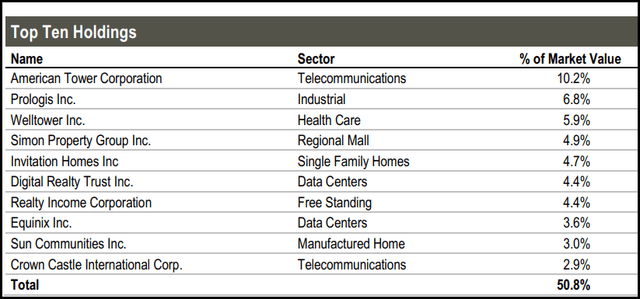
Other holdings that made the top ten list previously were Prologis (PLD), which was the fund’s largest holding, Welltower (WELL), Simon Property (SPG), Invitation Homes Inc (INVH), Digital Realty Trust (DLR), Realty Income (O) and Equinix (EQIX).
That only leaves Sun Communities Inc. (SUI) and Crown Castle (CCI). Rest assured that these two names were holdings in the fund at that time, according to that quarterly N-PORT filing; they just weren’t as large of holdings at that time.
From the end of March to the end of December 2023, DLR performed the best by a wide margin. SPG and WELL had some strong performances as well. In fact, it was AMT that came in at the bottom half, but it still saw its weighting climb material.
Ycharts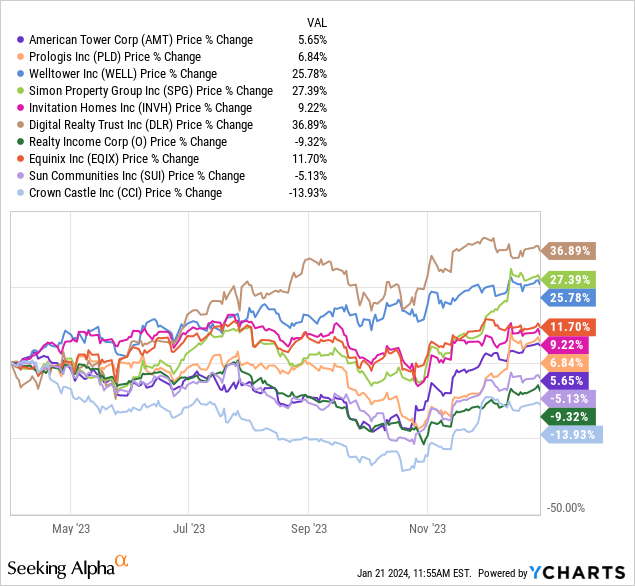
Of course, one of the contributing factors is that the managers were adding shares to see that type of change. This appeared to happen gradually throughout the year as well. First, in the March N-PORT, we saw 86,483 shares being held. The semi-annual report listed 92,635 shares, and the period ending September N-PORT showed a whopping 149,224 shares being held.
As of the last full holdings list, they had a current market value of $32,214,477.12. From there, we can simply take the last closing price of the year on December 29, 2023, and see that shares closed at $215.88 per share for AMT. That calculates out to the same 149,224 shares that the fund is still holding.
RFI Tope Ten Holdings (Cohen & Steers)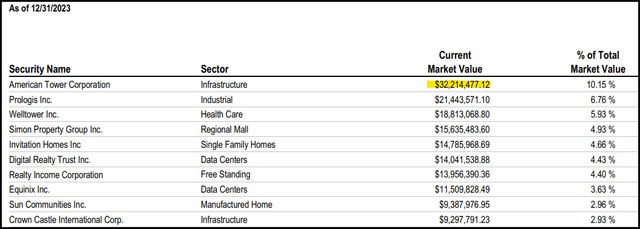
Conclusion
RFI is a non-leveraged fund that holds primarily equity REIT holdings. However, the fund also incorporates a sleeve of preferred and fixed-income instruments. That makes it an interest rate-sensitive fund, but with rates looking to come down in the next year or two, that puts RFI in a potentially strong position. Ideally, I’d want to see the fund trading at a discount to feel like I was getting a ‘good deal,’ but even picking up a long-term position at a fair price can result in strong results in the future.
For investors willing to step up the risk profile, its leveraged sister fund RQI is also a consideration. There, investors are getting a bit of a discount, but with leverage comes higher volatility and potentially lower returns if things turn sour.


